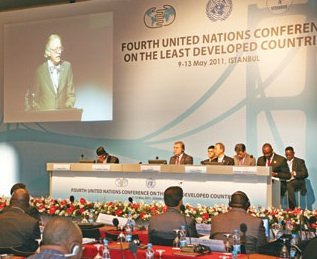
Some certainly are. This week there’s been a big UN meeting about the world’s poorest countries – the 4th UN conference on the Least Developed Countries (LDCs).
Surprisingly, one Least Developed Country (LDC) is now a high-income country (Equatorial Guinea) and 13 more are now middle-income countries (MICs). However, most of these new MICs are islands with very low populations and poverty remains very high in the LDCs.
The, currently 48 Least Developed Countries has been the group of UN recognized poorest countries (defined as low income; low human assets; economically vulnerable) for forty years and received preferential treatment in trade; development finance and technical assistance and a well-regarded annual report from UNCTAD.
Recent sophisticated estimates of poverty in the LDCs suggests poverty levels (US$1.25 poverty line) have doubled since 1980 from 184m people to about 360m people.
A very quick and dirty data download from the World Bank’s database into this excel suggests –
Although, somewhere between a quarter and a third of world poverty is in the LDCs, 40% of the world’s out of primary school children are in LDCs and the overall poverty rate in LDCs is, on average, much more severe – more than half (55%) of the population of LDCs live under the US$1.25 poverty line used above and this hasn’t changed in thirty years (there has also been a large increase in population in the LDCs group from about 500m to more than 800m people over the last twenty years) and two-thirds of the LDC population are poor if one takes non-monetary poverty by the new UNDP multi-dimensional poverty measure.
There is some good news tho – on some poverty dimensions, 1990 vs 2007 – there have been improvements in literacy rates from 51% to 62%; secondary enrolment 18% to 35% and under 5 year old mortality fell from 166 to 119.
There is still what the UN calls a ‘structural handicap’ – literacy has only risen from 51% to 62%; and although aid dependency has fallen from 19% of GNI to 16% it remains high.
Most interestingly, 30 of the 49 LDCs countries are currently FCAS (meaning fragile and conflict-affected states – using the broadest definition of three combined FCAS lists) and *all* have been FCAS at some point in their history.
There is surprisingly little difference between LDC FCAS versus LDC non-FCAS on GNI per capita and GNI per capita trends and income poverty.
But there are large differences between the MIC LDCs versus LIC (low-income countries) LDCs in US$1.25 incidence – 33% versus 54%; in multi-dimensional poverty – 69% vs 55%; in literacy – 81% versus 56%; in under 5 year old mortality – U5M 133 vs 77; and in GNI per capita – US$1000 versus $3000 per capita. There are large differences in ‘structural handicap’ – in secondary enrolment 31% vs 49%; and in ODA as a percentage of GNI – 18% vs 12%.
There are also big differences between LDC FCAS and LDC non-FCAS if one considers nutrition and education poverty (which are much worse in FCAS LDCs) and there are also big differences on ‘structural handicaps’ (e.g. secondary enrolment is much lower in the FCAS LDCs and aid dependency much higher in FCAS LDCs group (19% vs 11% in the non-FCAS LDCs).
Gini (inequality) data is very limited. Data for the income share of bottom quintile is better and the proportion is around 5-6% and has not changed in twenty years. The UNICEF equity report included data on the bottom quintiles which suggested significantly weaker MDG data among the poorest (e.g. children under 5 years underweight – LDC average of 28% vs 34% in the LDC bottom quintile).
There have been significant impacts of global crisis in terms of growth decelerations – based on UNDESA data suggests pre-crisis the LDC average growth rate reached 9% in 2007 but fell to an estimated 3% in 2009 and are projected to bounce back to 5% in 2010.
Congrats anyone who’s got to this point without glazing over with all the stats…
What does it all add up to?
I wonder if the core LDC group could probably be smaller and focused on those countries that are:
– Fragile and conflict-affected (FCAS);
– Low income countries (LIC);
– Aid dependent.
This would likely mean about 18 sub-Saharan African countries in the original 48 LDCs with these characteristics. The question then follows what can be done for these 18 by the international community to provide peace, prosperity and a non-aid future at some point in time?


